BOYS TEAMS


GIRLS TEAMS


Archive
Champions | ArtworkPlayers
Leading Scorers | Highest Average | Games PlayedTeams
Championships | Wins | Win Percentage | PointsArchive
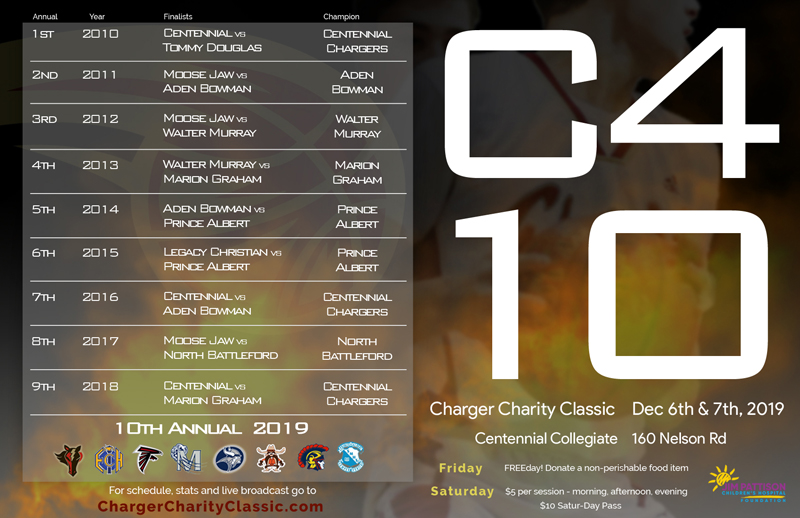
Past Champions
2023 Champions


2022 Champions


2021 Champions


2019 Champions


2018 Champions


2017 Champions


2016 Champions


2015 Champions


2014 Champions


2013 Champions


2012 Champions


2011 Champions


2010 Champions


Artwork


Players
Tournament Overall Leading Scorers
| Place | Player | Points | Games | Average |
|---|---|---|---|---|
| 1st |  Simon Engen Simon EngenEvan Hardy Souls 2017, 2018, 2019 | 211 | 8 | 26.38 |
| 2nd |  Ben Gaskin Ben GaskinMarion Graham Falcons 2018, 2019 | 147 | 6 | 24.50 |
| 3rd |  Keon Cleland Keon ClelandCentennial Chargers 2017, 2018, 2019 | 143 | 9 | 15.89 |
| 4th |  Connor Murray Connor MurrayPrince Albert St. Mary High School 2012, 2013, 2014, 2015 | 143 | 10 | 14.30 |
| 5th |  Jordin Rusnack Jordin RusnackYorkton Regional Raiders 2016, 2017, 2018 | 142 | 7 | 20.29 |
| 6th | Braden Akers P.A. St. Mary Marauders 2021, 2022, 2023 | 137 | 8 | 17.13 |
| 7th |  Arvin Rabino Arvin RabinoNorth Battleford Vikings 2021, 2022, 2023 | 137 | 9 | 15.22 |
| 8th | Avery Chubb Marion Graham Falcons 2021, 2022, 2023 | 134 | 8 | 16.75 |
| 9th |  Simon Pankratz Simon PankratzTommy Douglas Tigers 2016, 2017 | 133 | 5 | 26.60 |
| 10th | Noah Bymak Yorkton Raiders 2017, 2018, 2019 | 130 | 9 | 14.44 |
| 11th | Tyson Korol Yorkton Raiders 2022, 2023 | 127 | 5 | 25.40 |
| 12th | Damon Dutton North Battleford Vikings 2014, 2015, 2017 | 127 | 8 | 15.88 |
| 13th | Evan Parchomchuk Prince Albert St. Mary High School 2012, 2013, 2014, 2015 | 123 | 11 | 11.18 |
| 14th | Eli Paulsen Centennial Chargers 2021, 2022, 2023 | 120 | 8 | 15.00 |
| 15th | Daniel Mandziuk Yorkton Regional Raiders 2010, 2010, 2011, 2012 | 120 | 9 | 13.33 |
| 16th |  Anmol Gill Anmol GillBedford Road Redhawks 2022, 2023 | 117 | 6 | 19.50 |
| 17th |  Levi Beaudry Levi BeaudryLegacy Christian Academy 2014, 2015 | 115 | 6 | 19.17 |
| 18th | Nick Johnson Centennial Chargers 2016, 2017, 2018 | 105 | 8 | 13.13 |
| 19th | Matthew Bryant Centennial Chargers 2017, 2018 | 98 | 6 | 16.33 |
| 20th |  Tiegen Derksen Tiegen DerksenAden Bowman Bears 2014, 2015 | 97 | 6 | 16.17 |
Tournament Overall Highest Average
| Place | Player | Average | Points | Games |
|---|---|---|---|---|
| 1st | Evan Halyk Prince Albert St. Mary High School 2011 | 33.00 | 66 | 2 |
| 2nd |  Reid Thuringer Reid ThuringerChristian Centre Academy 2011 | 27.00 | 81 | 3 |
| 3rd | Brandon Ritzand Bedford Road Redmen 2010 | 26.67 | 80 | 3 |
| 4th |  Chris Fryett-Miller Chris Fryett-MillerWalter Murray Marauders 2012 | 26.67 | 80 | 3 |
| 5th | Simon Pankratz Tommy Douglas Tigers 2016, 2017 | 26.60 | 133 | 5 |
| 6th | Simon Engen Evan Hardy Souls 2017, 2018, 2019 | 26.38 | 211 | 8 |
| 7th | Tyson Korol Yorkton Raiders 2022, 2023 | 25.40 | 127 | 5 |
| 8th | Ben Gaskin Marion Graham Falcons 2018, 2019 | 24.50 | 147 | 6 |
| 9th | Ryan Schmidt Centennial Chargers 2010 | 24.00 | 72 | 3 |
| 10th | Micah Pankratz Tommy Douglas Tigers 2017 | 23.00 | 23 | 1 |
| 11th | Brandon Tolentino Prince Albert St. Mary High School 2015 | 22.67 | 68 | 3 |
| 12th | Cody Buziak North Battleford Composite Vikings 2010 | 21.33 | 64 | 3 |
| 13th | Jordin Rusnack Yorkton Regional Raiders 2016, 2017, 2018 | 20.29 | 142 | 7 |
| 14th | Addison Dewar Marion Graham Falcons 2013 | 19.67 | 59 | 3 |
| 15th | Anmol Gill Bedford Road Redhawks 2022, 2023 | 19.50 | 117 | 6 |
| 16th | Conlan Bear North Battleford Vikings 2018 | 19.50 | 39 | 2 |
| 17th | Levi Beaudry Legacy Christian Academy 2014, 2015 | 19.17 | 115 | 6 |
| 18th |  Mac Simpson Mac SimpsonMoose Jaw A.E. Peacock Collegiate Toilers 2022 | 19.00 | 57 | 3 |
| 19th | Cain Witzaney North Battleford Vikings 2017 | 19.00 | 19 | 1 |
| 20th | Keaven Simes Aden Bowman Bears 2010 | 18.67 | 56 | 3 |
Tournament Overall Games Played
| Place | Player | Games | Points | Average |
|---|---|---|---|---|
| 1st | Evan Parchomchuk Prince Albert St. Mary High School 2012, 2013, 2014, 2015 | 11 | 123 | 11.18 |
| 2nd | Cole Simon North Battleford Vikings 2012, 2013, 2014, 2015 | 11 | 77 | 7.00 |
| 3rd | Connor Murray Prince Albert St. Mary High School 2012, 2013, 2014, 2015 | 10 | 143 | 14.30 |
| 4th | Keon Cleland Centennial Chargers 2017, 2018, 2019 | 9 | 143 | 15.89 |
| 5th | Arvin Rabino North Battleford Vikings 2021, 2022, 2023 | 9 | 137 | 15.22 |
| 6th | Noah Bymak Yorkton Raiders 2017, 2018, 2019 | 9 | 130 | 14.44 |
| 7th | Daniel Mandziuk Yorkton Regional Raiders 2010, 2010, 2011, 2012 | 9 | 120 | 13.33 |
| 8th | Ben Redl Yorkton Regional Raiders 2010, 2011, 2012 | 9 | 94 | 10.44 |
| 9th | Arthur Schuler Aden Bowman Bears 2014, 2015, 2016 | 9 | 83 | 9.22 |
| 10th | Ethan Wandzura P.A. St. Mary Marauders 2017, 2018, 2019 | 9 | 80 | 8.89 |
| 11th | Luke Donauer Legacy Christian Academy 2014, 2015, 2016 | 9 | 68 | 7.56 |
| 12th | Tyson Black Yorkton Regional Raiders 2013, 2014, 2015 | 9 | 64 | 7.11 |
| 13th | Adam Keen Centennial Chargers 2016, 2017, 2018 | 9 | 60 | 6.67 |
| 14th | Matt Dutton North Battleford Vikings 2012, 2013, 2014, 2015 | 9 | 56 | 6.22 |
| 15th | Caleb Bymak Yorkton Regional Raiders 2013, 2014, 2015 | 9 | 40 | 4.44 |
| 16th | Simon Engen Evan Hardy Souls 2017, 2018, 2019 | 8 | 211 | 26.38 |
| 17th | Braden Akers P.A. St. Mary Marauders 2021, 2022, 2023 | 8 | 137 | 17.13 |
| 18th | Avery Chubb Marion Graham Falcons 2021, 2022, 2023 | 8 | 134 | 16.75 |
| 19th | Damon Dutton North Battleford Vikings 2014, 2015, 2017 | 8 | 127 | 15.88 |
| 20th | Eli Paulsen Centennial Chargers 2021, 2022, 2023 | 8 | 120 | 15.00 |
Teams
Tournament Overall Championships
| Place | Player | Championships | Wins | Losses | Win % | Points |
|---|---|---|---|---|---|---|
| 1st | Centennial Chargers 2010, 2011, 2012, 2013, 2014, 2015, 2016, 2017, 2018, 2019, 2021, 2022, 2023 | 6 | 30 | 9 | 76.92% | 2875 |
| 2nd | Walter Murray Marauders 2012, 2013, 2015, 2017, 2019, 2021, | 2 | 13 | 5 | 72.22% | 1276 |
| 3rd | Prince Albert Carlton Crusaders 2010, 2011, 2012, 2013, 2014, 2015, 2016, 2017, 2018, 2019, 2021, 2022, 2023 | 2 | 20 | 19 | 51.28% | 2700 |
| 4th | Aden Bowman Bears 2010, 2011, 2012, 2014, 2015, 2016, | 1 | 12 | 6 | 66.67% | 1193 |
| 5th | Marion Graham Falcons 2013, 2018, 2019, 2021, 2022, 2023, | 1 | 10 | 8 | 55.56% | 1326 |
| 6th | North Battleford Composite Vikings 2010, 2012, 2013, 2014, 2015, 2017, 2018, 2019, 2021, 2022, 2023 | 1 | 12 | 21 | 36.36% | 2050 |
Tournament Overall Wins
| Place | Player | Wins | Losses | Win % | Championships | Points |
|---|---|---|---|---|---|---|
| 1st | Centennial Chargers 2010, 2011, 2012, 2013, 2014, 2015, 2016, 2017, 2018, 2019, 2021, 2022, 2023 | 30 | 9 | 76.92% | 6 | 2875 |
| 2nd | Prince Albert Carlton Crusaders 2010, 2011, 2012, 2013, 2014, 2015, 2016, 2017, 2018, 2019, 2021, 2022, 2023 | 20 | 19 | 51.28% | 2 | 2700 |
| 3rd | Yorkton Regional Raiders 2010, 2011, 2012, 2013, 2014, 2015, 2016, 2017, 2018, 2019, 2021, 2022, 2023 | 16 | 23 | 41.03% | 0 | 2491 |
| 4th | Walter Murray Marauders 2012, 2013, 2015, 2017, 2019, 2021, | 13 | 5 | 72.22% | 2 | 1276 |
| 5th | North Battleford Composite Vikings 2010, 2012, 2013, 2014, 2015, 2017, 2018, 2019, 2021, 2022, 2023 | 12 | 21 | 36.36% | 1 | 2050 |
| 6th |  Moose Jaw Central Collegiate Moose Jaw Central Collegiate2011, 2012, 2013, 2014, 2015, 2016, 2017 | 12 | 9 | 57.14% | 0 | 1358 |
| 7th | Aden Bowman Bears 2010, 2011, 2012, 2014, 2015, 2016, | 12 | 6 | 66.67% | 1 | 1193 |
| 8th | Marion Graham Falcons 2013, 2018, 2019, 2021, 2022, 2023, | 10 | 8 | 55.56% | 1 | 1326 |
| 9th | Evan Hardy Souls 2016, 2017, 2018, 2019, 2021, 2022, 2023 | 7 | 14 | 33.33% | 0 | 1305 |
| 10th | Tommy Douglas Tigers 2010, 2011, 2013, 2014, 2016, 2017, 2021 | 5 | 16 | 23.81% | 0 | 1076 |
| 11th | Bedford Road Redmen 2010, 2011, 2022, 2023 | 5 | 7 | 41.67% | 0 | 750 |
| 12th | Legacy Christian Academy 2014, 2015, 2016 | 5 | 4 | 55.56% | 0 | 607 |
| 13th | Moose Jaw A.E. Peacock 2018, 2022, 2023 | 4 | 5 | 44.44% | 0 | 613 |
| 14th | Christian Centre Academy 2011, 2012 | 3 | 3 | 50.00% | 0 | 302 |
| 15th |  Regina Sheldon Williams Regina Sheldon Williams2018, 2019 | 2 | 4 | 33.33% | 0 | 332 |
Tournament Overall Win Percentage
| Place | Player | Win % | Wins | Losses | Championships | Points |
|---|
Tournament Overall Points
| Place | Player | Points | Average | Championships | Wins | Losses | Win % |
|---|---|---|---|---|---|---|---|
| 1st | Centennial Chargers 2010, 2011, 2012, 2013, 2014, 2015, 2016, 2017, 2018, 2019, 2021, 2022, 2023 | 2875 | 73.72 | 6 | 30 | 9 | 76.92% |
| 2nd | Prince Albert Carlton Crusaders 2010, 2011, 2012, 2013, 2014, 2015, 2016, 2017, 2018, 2019, 2021, 2022, 2023 | 2700 | 69.23 | 2 | 20 | 19 | 51.28% |
| 3rd | Yorkton Regional Raiders 2010, 2011, 2012, 2013, 2014, 2015, 2016, 2017, 2018, 2019, 2021, 2022, 2023 | 2491 | 63.87 | 0 | 16 | 23 | 41.03% |
| 4th | North Battleford Composite Vikings 2010, 2012, 2013, 2014, 2015, 2017, 2018, 2019, 2021, 2022, 2023 | 2050 | 62.12 | 1 | 12 | 21 | 36.36% |
| 5th | Moose Jaw Central Collegiate 2011, 2012, 2013, 2014, 2015, 2016, 2017 | 1358 | 64.67 | 0 | 12 | 9 | 57.14% |
| 6th | Marion Graham Falcons 2013, 2018, 2019, 2021, 2022, 2023, | 1326 | 73.67 | 1 | 10 | 8 | 55.56% |
| 7th | Evan Hardy Souls 2016, 2017, 2018, 2019, 2021, 2022, 2023 | 1305 | 62.14 | 0 | 7 | 14 | 33.33% |
| 8th | Walter Murray Marauders 2012, 2013, 2015, 2017, 2019, 2021, | 1276 | 70.89 | 2 | 13 | 5 | 72.22% |
| 9th | Aden Bowman Bears 2010, 2011, 2012, 2014, 2015, 2016, | 1193 | 66.28 | 1 | 12 | 6 | 66.67% |
| 10th | Tommy Douglas Tigers 2010, 2011, 2013, 2014, 2016, 2017, 2021 | 1076 | 51.24 | 0 | 5 | 16 | 23.81% |
| 11th | Bedford Road Redmen 2010, 2011, 2022, 2023 | 750 | 62.50 | 0 | 5 | 7 | 41.67% |
| 12th | Moose Jaw A.E. Peacock 2018, 2022, 2023 | 613 | 68.11 | 0 | 4 | 5 | 44.44% |
| 13th | Legacy Christian Academy 2014, 2015, 2016 | 607 | 67.44 | 0 | 5 | 4 | 55.56% |
| 14th | Regina Sheldon Williams 2018, 2019 | 332 | 55.33 | 0 | 2 | 4 | 33.33% |
| 15th | Christian Centre Academy 2011, 2012 | 302 | 50.33 | 0 | 3 | 3 | 50.00% |
| 16th |  Luther Lions Luther Lions2010 | 163 | 54.33 | 0 | 0 | 3 | 0.00% |
Thank You to Our Sponsors